June 16, 2025
Google Analytics attribution models provide marketers with a number of ways to see how customers are converting. There are a number of models available and in this article we will cover the different types of attribution models, what each will show you and how to compare the data across different models.
Every time a user completes an action on a website the conversion will be “attributed” to a visit in which the action was completed. Whilst sounding simple, it is not always the case. Conversions often don’t occur in one visit. When multiple touch points occur attribution is really important.
Attribution models in Google Analytics allow marketers to see which traffic sources, ads or factors contributed to a conversion at different stages of the funnel. By switching between the attribution models you will get a picture of which traffic sources perform best at different stages in the marketing funnel.
Within Google Analytics there are a number of existing attribution models to choose from.
The data driven attribution model is unlike the cross channel attribution models below in that it uses machine learning algorithms to apply value to interactions. This means that the attribution is created specifically for you based on historic data within the account. Where there is not enough data in the account Google will try to apply aggregate data from anonymous sources to create a model.
Cross channel attribution model splits the value of a conversion to each channel. The cross channel attributions models come in a number of different options available to marketers, including:
Last click attribution modelling will assign all of the conversion to the final action. This is useful if you are looking into which are the most valuable sources of conversion at the end of the funnel but can be deceptive to ignore actions earlier in the user journey.
First click attribution is the opposite of last click in that it assigns 100% of the value of the conversion to the first visit.
A linear attribution model assigns equal value to all of the channels used to generate the conversion. It does not matter how many touch points are used, equal value will be shared.
Position based attribution will apply most of the credit to the first and last interaction. With the remaining value split evenly across the actions in between. 40% of the credit will be given to the first interaction and 40% of the credit will be assigned to the last interaction with the remaining 20% allocated to the remaining channels.
The time decay model assigns a higher value to interactions that happened closer to the final conversion. The value of an interaction is halved every 7 days prior to the interaction. For example a click 8 days prior to the final conversion gets half as much credit as a click 1 day before the conversion.
The ads-preferred model will credit the last Google Ad click with 100% of the conversion. This helps to identify which was the converting visit based on Ad interactions however discounts actions higher in the funnel.
There are a number of ways to view the various attribution models in Google Analytics. While the future is in GA4, we will cover both GA4 and Universal Analytics.
Both GA4 and Universal Analytics contain pre-created reports to showcase the different performance levels by model.
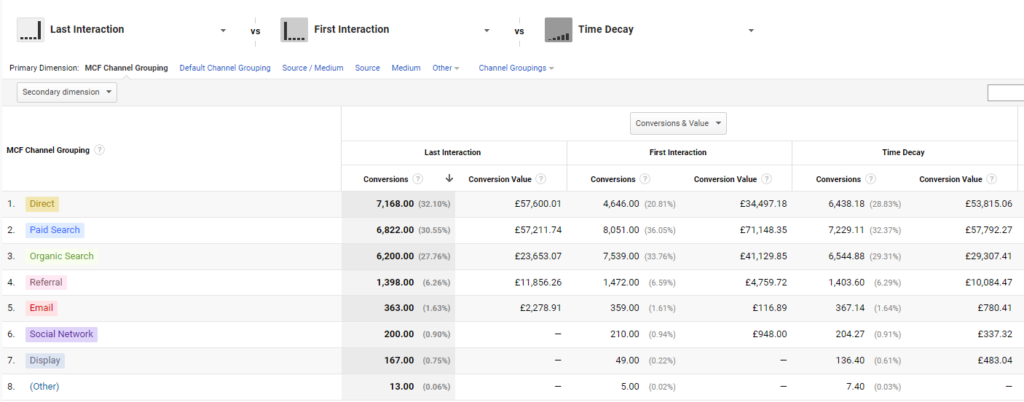
When looking at a data view in Universal Analytics navigate to Conversions > Multi-Channel Funnels > Model Comparison tool to see the performance per channel.

In GA4 navigate to Advertising > Attribution > Model Comparison

From either of these views you can change the attribution model you wish to view and compare the performance of the channels.
Again, both GA4 and Universal Analytics provide conversion paths to showcase the different performance levels at different stages of the buying cycle.
In UA navigate to Conversions > Multi-Channel Funnels > Top Conversion Paths

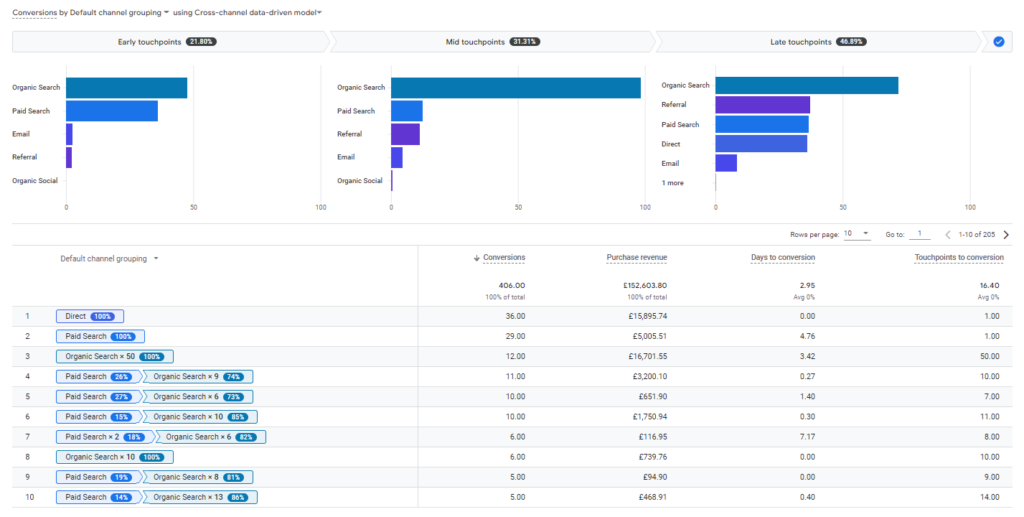
In GA4 navigate to Advertising > Attribution > Conversion Paths

Both of these views provide invaluable insight into the touchpoints involved in a conversion and where different traffic sources or channels sit within the conversion process.
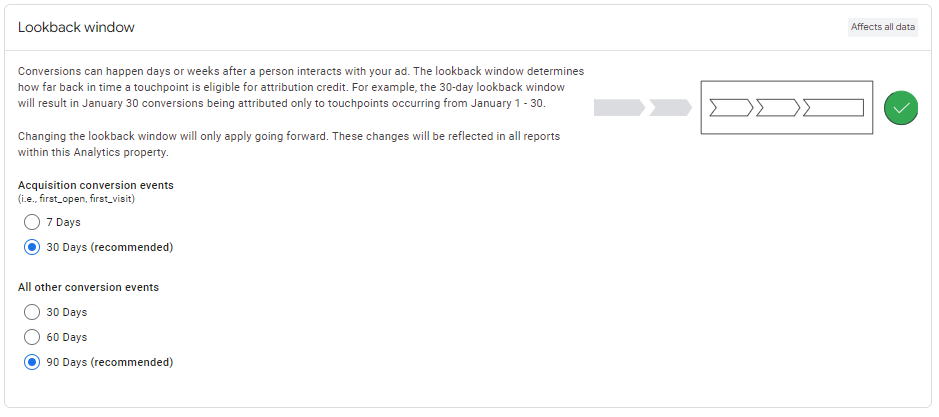
In Google Analytics 4 it is possible to change the default attribution modelling used within the GA4 property. Simply navigate to Admin, then under the property click “Attribution Settings”.
From this view it is possible to change the attribution model used in the account. Cross-channel data driven model will be setup as default. However you can change it here to be any attribution model.

It is also possible here to change the length of time Analytics will “lookback” for a conversion. As conversions often take a significant time to materialise we recommend leaving these settings to the longest time frame.

There isn’t really a right or a wrong answer here, however we do have a couple of recommendations.
Firstly, we recommend leaving the reporting attribution model as the data-driven model in most cases. This will create the most accurate method of reporting for your business. In theory providing the most valuable insights into which channels are driving value. However, there could be reason to make a change. For example, if you need to report across multiple sites or multiple properties in a consistent way. In this case we would recommend using the time-decay or position based models.
Next, we recommend you regularly review your conversion attribution models & conversion paths. This will give a great insight into your overall customer journey and allow optimisation of areas that drop out within the funnel.
Understanding your conversion paths and therefore customer purchasing funnels is a really important step for a marketer as it will help inform decisions and optimisations.
Tags:
If you have an idea in mind, feel free to reach out by submitting the form below to schedule a discovery call with us.