March 30, 2026
Launching an ecommerce business is exciting. Sales start coming in, traffic begins to grow and suddenly there are more dashboards, analytics tools and marketing reports than you know what to do with.
The challenge for many startup founders isn’t a lack of data. It’s knowing which numbers actually matter.
Revenue alone doesn’t tell you whether your ecommerce business is healthy. A store can generate impressive sales while quietly losing money on advertising, struggling with poor conversion rates, or failing to retain customers over time.
Through our work with ecommerce brands at Candid Digital, we’ve found that the difference between businesses that scale and those that stall usually comes down to a handful of core performance metrics. These numbers reveal whether your marketing is efficient, whether your website is converting visitors effectively, and whether your growth is sustainable.
Below are ten ecommerce metrics every startup founder should understand, along with typical benchmarks to help you understand how your business compares.

Before diving into each metric, here are a few common ecommerce benchmarks that many growing brands use as a reference point.
| Metric | Typical Benchmark |
|---|---|
| Conversion Rate | 1–3% |
| Return on Ad Spend (ROAS) | 3–5x |
| LTV : CAC Ratio | 3:1 or higher |
| Repeat Purchase Rate | 25–40% |
| Cart Abandonment Rate | 60–80% |
| Revenue Per Visitor | £1–£3 typical range |
| Gross Margin | 50–70% ideal for scaling ads |
Your conversion rate measures the percentage of visitors who complete a purchase on your website.
Formula
Conversions ÷ Website Visitors × 100
For most ecommerce stores, conversion rates typically fall somewhere between 1% and 3%.
This means that if 1,000 people visit your website, around 10 to 30 of them will place an order.
Why does this matter? Because conversion rate directly influences how efficient your marketing spend is.
For example, if you’re paying £2 per click through paid advertising and your website converts at 1%, you’re effectively paying £200 to acquire a single customer before factoring in product costs or overheads.
Improving conversion rate is often one of the fastest ways to increase profitability. Even small changes to product pages, checkout flows or mobile usability can have a significant impact on overall revenue.
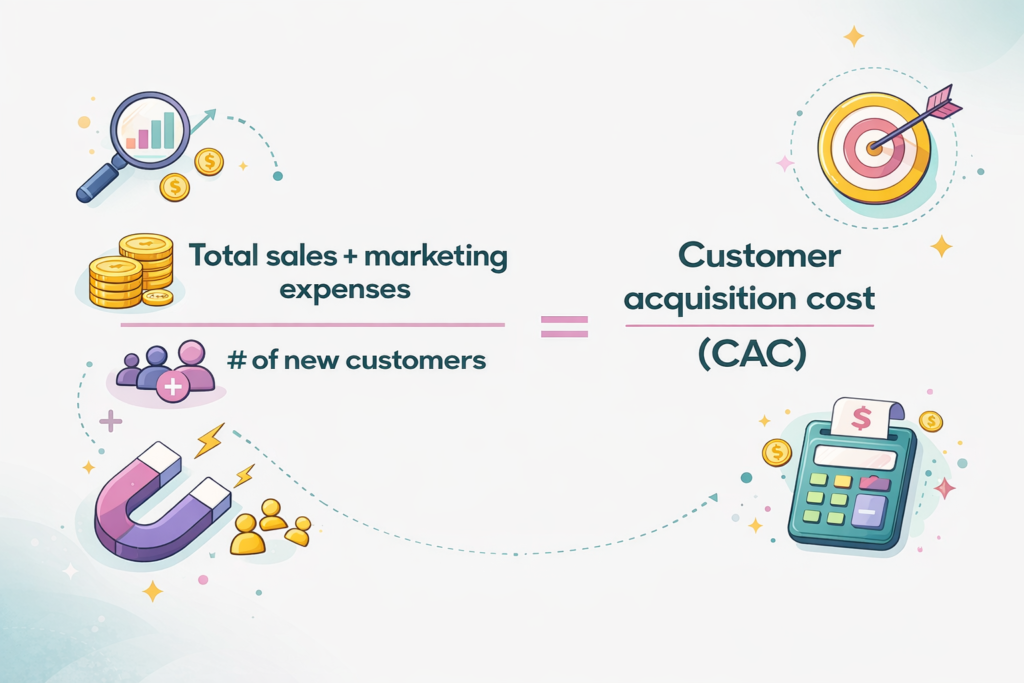
Customer Acquisition Cost (CAC) tells you how much it costs to acquire a new customer.
Formula
Total Marketing Spend ÷ Number of New Customers
If you spend £5,000 on advertising in a month and acquire 100 new customers, your CAC would be £50.
Understanding CAC is critical for startups because it determines whether your marketing activity is financially sustainable.
Many founders underestimate how quickly acquisition costs can rise as they scale advertising. Platforms like Google Ads and Meta Ads become more competitive as budgets increase, which can drive up cost per click and ultimately increase CAC.
Tracking this metric closely helps ensure your marketing remains profitable as your business grows.
Return on Ad Spend measures how much revenue you generate for every pound spent on advertising.
Formula
Revenue Generated from Ads ÷ Advertising Spend
If you spend £1,000 on ads and generate £4,000 in revenue, your ROAS would be 4x.
Many ecommerce brands aim for a ROAS between 3x and 5x, although this depends heavily on product margins.
However, it’s important not to obsess over ROAS in isolation.
We often see ecommerce brands restrict ad spend too aggressively in pursuit of maintaining very high ROAS numbers. While this can make marketing performance look impressive on paper, it often limits the ability to scale revenue.
Sustainable growth usually requires balancing efficiency and volume, rather than optimising purely for the highest possible ROAS.
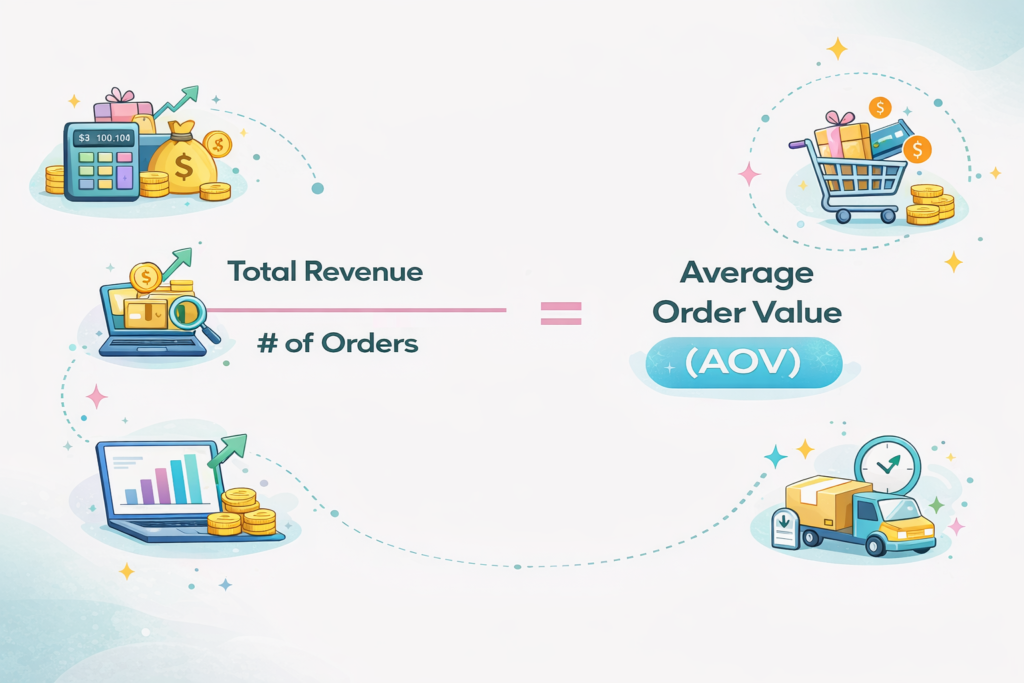
Average Order Value measures how much customers typically spend each time they place an order.
Formula
Total Revenue ÷ Number of Orders
If your store generates £10,000 from 200 orders, your average order value would be £50.
AOV is an important metric because increasing the amount customers spend per order can dramatically improve the efficiency of your marketing.
If your average order value increases from £50 to £65, your revenue increases by 30% without needing to generate any additional traffic.
Many ecommerce brands improve AOV through simple tactics such as product bundles, upsells at checkout or free shipping thresholds that encourage customers to add one more item to their basket.
For startups, improving AOV is often one of the quickest ways to increase profitability without increasing advertising spend.
Customer Lifetime Value estimates how much revenue a customer will generate for your business over the course of their relationship with your brand.
Unlike CAC, which focuses on the cost of acquiring a customer, LTV looks at the long-term value that customer delivers.
For many successful ecommerce businesses, the goal is to achieve an LTV to CAC ratio of at least 3:1.
This means that if it costs £40 to acquire a customer, you would ideally generate £120 or more in total revenue from that customer over time.
Businesses with strong repeat purchasing behaviour often find it much easier to scale because they can afford to spend more on acquiring new customers while remaining profitable.
Retention strategies such as email marketing, loyalty programmes and post-purchase engagement can all help increase customer lifetime value.
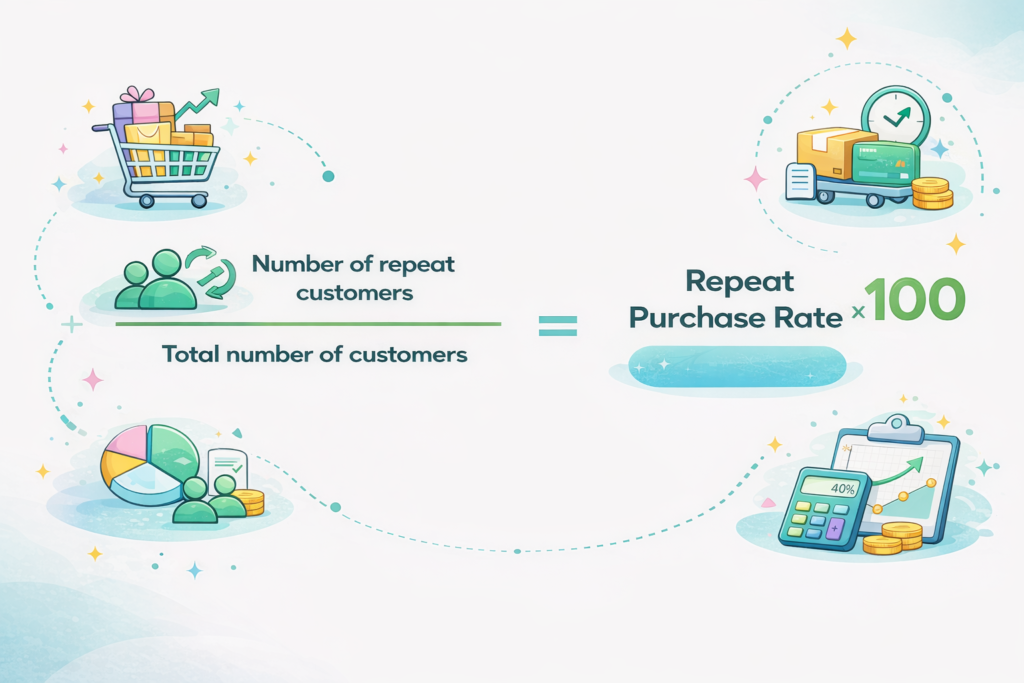
Repeat Purchase Rate measures the percentage of customers who return to make another purchase after their first order.
For many ecommerce businesses, a significant portion of revenue comes from returning customers rather than new ones.
A strong repeat purchase rate typically falls somewhere between 25% and 40%, although this varies depending on the type of product being sold.
Products that are consumable or frequently replaced tend to have much higher repeat purchase behaviour.
Tracking this metric helps founders understand whether they are building a brand customers want to come back to, rather than relying solely on acquiring new traffic.
Improving retention is often more cost-effective than continually increasing acquisition budgets.
Cart abandonment measures how many customers add products to their basket but leave the website before completing checkout.
Across the ecommerce industry, cart abandonment rates typically fall between 60% and 80%.
While this may sound alarming, it is completely normal behaviour for online shoppers who are browsing, comparing prices or simply not ready to purchase yet.
However, unusually high abandonment rates can indicate problems with the checkout experience.
Common causes include:
unexpected shipping costs
complicated checkout processes
lack of trust signals
slow page loading speeds
Many ecommerce brands reduce abandonment by sending automated reminder emails or offering simple checkout options such as express payments.
Traffic growth measures whether the number of people visiting your website is increasing over time.
Without a consistent flow of new visitors, it becomes difficult for ecommerce businesses to scale revenue.
Most successful ecommerce brands generate traffic through a mix of channels, including:
organic search
paid advertising
social media
email marketing
direct brand searches
Monitoring traffic trends helps founders identify whether marketing activities are successfully attracting new potential customers.
However, it’s important to remember that traffic alone doesn’t guarantee success. The quality of traffic and how well your website converts visitors ultimately determines whether that traffic turns into revenue.

Gross margin measures the profitability of the products you sell before marketing and operating costs are taken into account.
Formula
Revenue − Cost of Goods Sold
Many startup founders focus heavily on marketing metrics without fully understanding their product margins.
Even strong advertising performance can struggle to generate profit if margins are too low.
Understanding your gross margin allows you to determine how much you can realistically spend on acquiring customers while remaining profitable.
This metric plays an important role in setting realistic targets for CAC and ROAS.
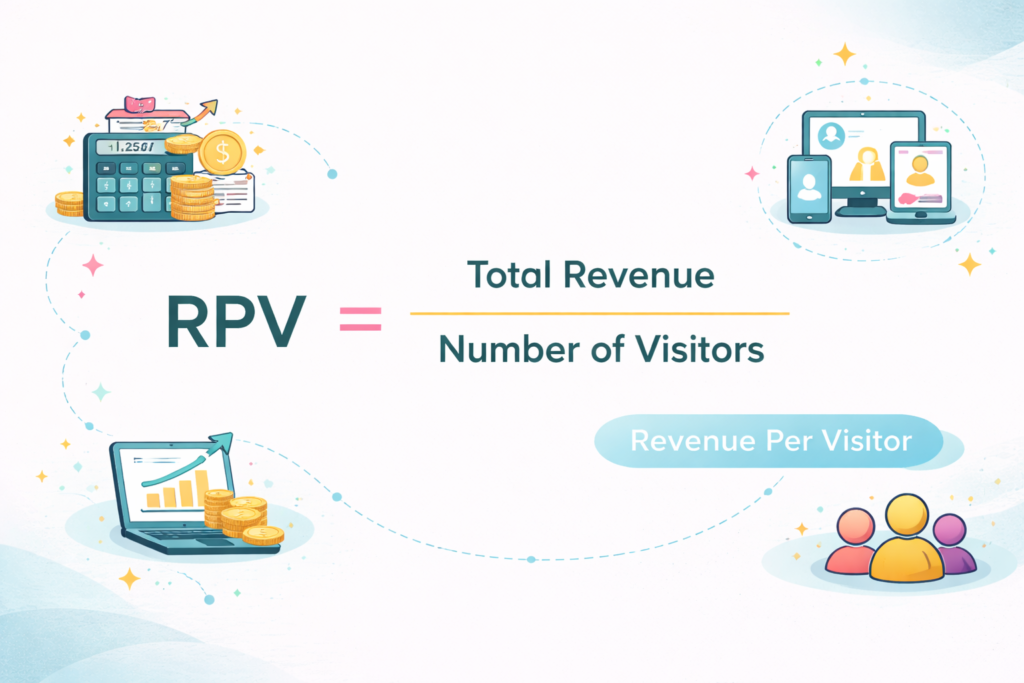
Revenue Per Visitor (RPV) combines two important metrics: conversion rate and average order value.
Formula
Total Revenue ÷ Total Website Visitors
This metric provides a clear view of how effectively your website turns traffic into revenue.
For example, if 10,000 visitors generate £20,000 in revenue, your revenue per visitor would be £2.
Improving RPV usually involves improving conversion rate, increasing order value or both.
For many ecommerce brands, small improvements to these two metrics can have a significant impact on overall revenue without needing to increase marketing spend.
Understanding ecommerce metrics is one thing. Knowing how to act on them is where real growth happens.
One of the most common mistakes we see startups make is focusing on a single number, usually revenue or ROAS, without looking at the wider picture. In reality, these metrics work together and often influence each other.
For example, if your conversion rate is low, increasing advertising spend will simply increase the cost of acquiring customers. On the other hand, if your repeat purchase rate is strong, you may be able to spend more on acquiring new customers because those customers generate revenue over time.
The key is to review these numbers regularly and identify where the biggest opportunities exist.
For many ecommerce startups, growth often comes from relatively small improvements such as:
Improving conversion rate through better product pages and mobile UX
Increasing average order value through bundles or upsells
Reducing acquisition costs through better targeting and creative
Increasing lifetime value through email marketing and retention strategies
When founders understand how these metrics connect, it becomes much easier to make confident marketing decisions and scale sustainably.
Launching an ecommerce business comes with an overwhelming amount of data. It’s easy to get distracted by dashboards and reports without knowing which numbers actually matter.
The most successful ecommerce brands tend to focus on a small set of metrics that directly influence growth and profitability. By tracking things like conversion rate, customer acquisition cost, lifetime value and order value, founders gain a much clearer understanding of how their business is really performing.
At Candid Digital, we regularly work with ecommerce brands across Nottingham and the UK to help them improve these key metrics through better websites, smarter paid media strategies and data-led growth.
If you’d like to see examples of how we’ve helped brands grow online, you can explore our recent work
Or if you’re looking for support improving your ecommerce performance, feel free to get in touch with our team